One of the reasons I made my MLB Division Race Charts site is that a simple graph of wins and losses can really tell a story over a season. And the Astros’ story has not been good this year!
Part 1: The season begins catastrophically
March 27 – May 8
Record: 12-24
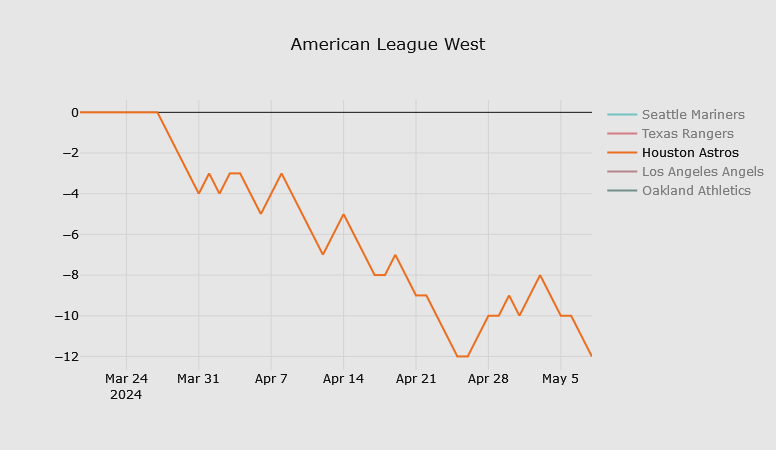
This is quite bad! I had the 7-19 record as of April 25 as when the Astros hit rock bottom, but I forgot that they were also 12 games under .500 two weeks later on May 8 as well. Simply brutal.
Part 2: The winning streak
May 8 – May 17
Record over this period: 8-1
Record at the end of this period: 20-25

Hey, a nice winning streak! It ended with them still being 5 games under .500, but that was a vast improvement and gave me hope for the rest of the season.
You may notice this period is very short at just a week and a half…
Part 3: Stuck in neutral
May 17 – June 17
Record over this period: 13-14
Record at the end of this period: 33-39
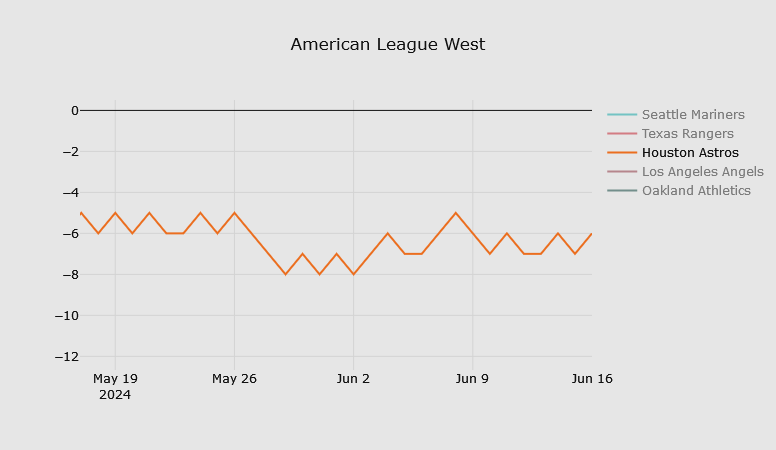
This is a whole dang month with one 3 game losing streak, two 2 game winning streaks, and one 2 game losing streak immediately after a 2 game winning streak. All the rest is just alternating wins and losses. This is purgatory in graph form, and helps explain why I haven’t quite given up hope for the Astros making the postseason. (still a 34% chance as of today!) But this is obviously not going to get it done!
